Register to get your FREE Healthcare fully editable QI Toolkit!
=
Have you every tried to keep all your resources together in one place when undertaking a quality improvement project. Especially when trying to improve the more complex problems within Healthcare. Sure there are plenty of tools out there to help. But rarely do they offer a one-stop solution to plan and deliver your improvement,
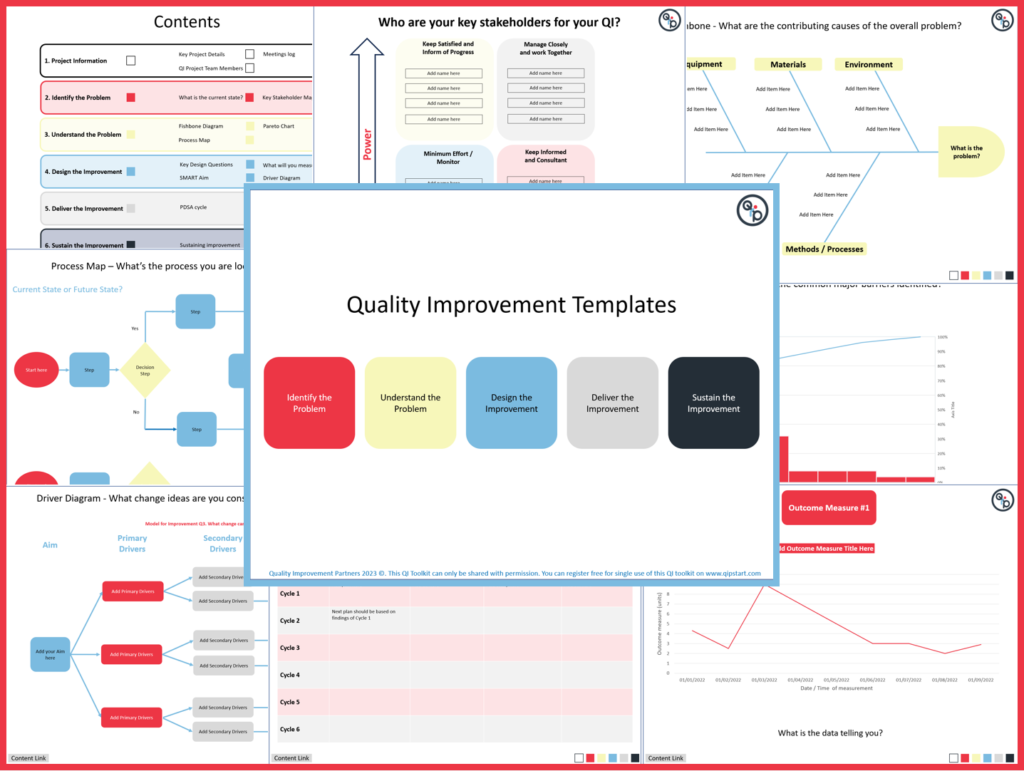
Our Quality Improvement Templates don’t just have all the most commonly used QI tools, but also…
1. They are editable for you to enter information as you progress with your QI. You can create a process map, add and display data to a pareto chart or a run chart. You can describe each PDSA cycle as it happens.
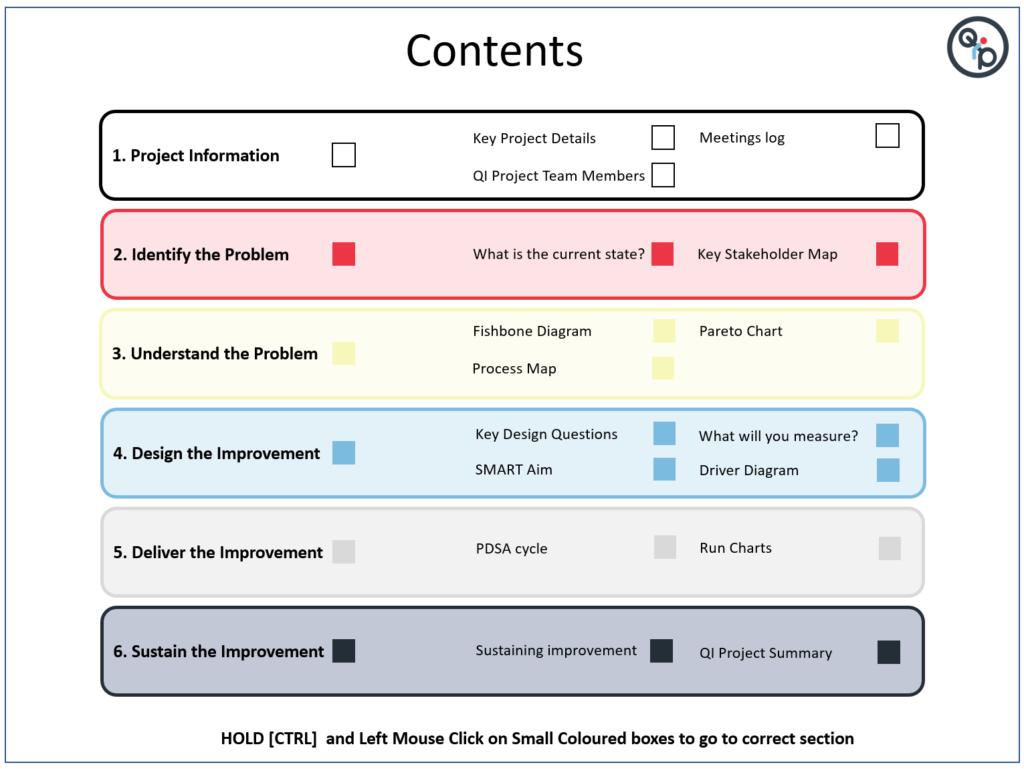
2. They are shown in a logical order as to when you will encounter them. The five stages. Identify a Problem, Understand the Problem, Design the Improvement, Deliver the Improvement and Sustain the Improvement.
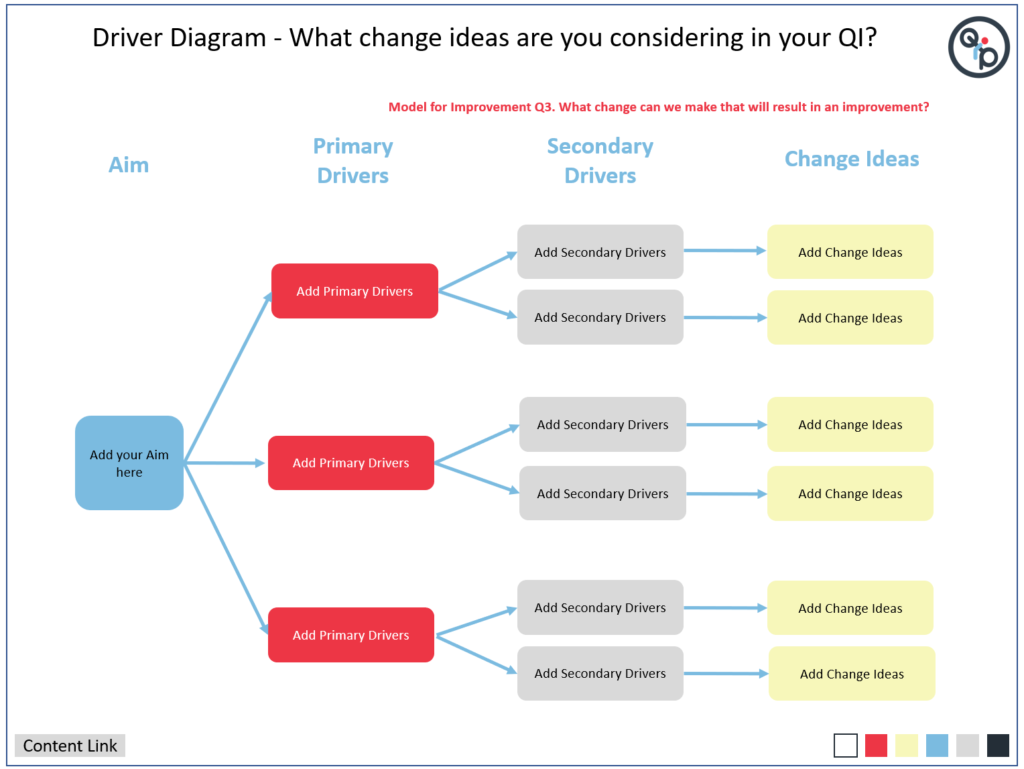
3. If you are a fan of Model for Improvement. The slides that indicate the 3 questions and the PDSA cycles are clearly marked in red.
4. The QI Toolkit is kept within Microsoft PowerPoint. Now how helpful is that! You can update the project at your leisure and share with colleagues either by e-mail or on a shared drive.
5. You can move rapidly across the toolkit to the correct section using the colour coded navigation boxes to update information.
6. The QI Toolkit allows gives prompts and asks many some important questions as you progress with your QI. Such as; what is it like now? who are your key stakeholders? and what are the likely obstacles you may face?
7. The toolkit allows flexibility in what sections you will need to complete. You don’t have to use it all!
8. All the QI toolkit items, including when and how to use them are explained in our Introduction to Healthcare Quality Improvement Course.
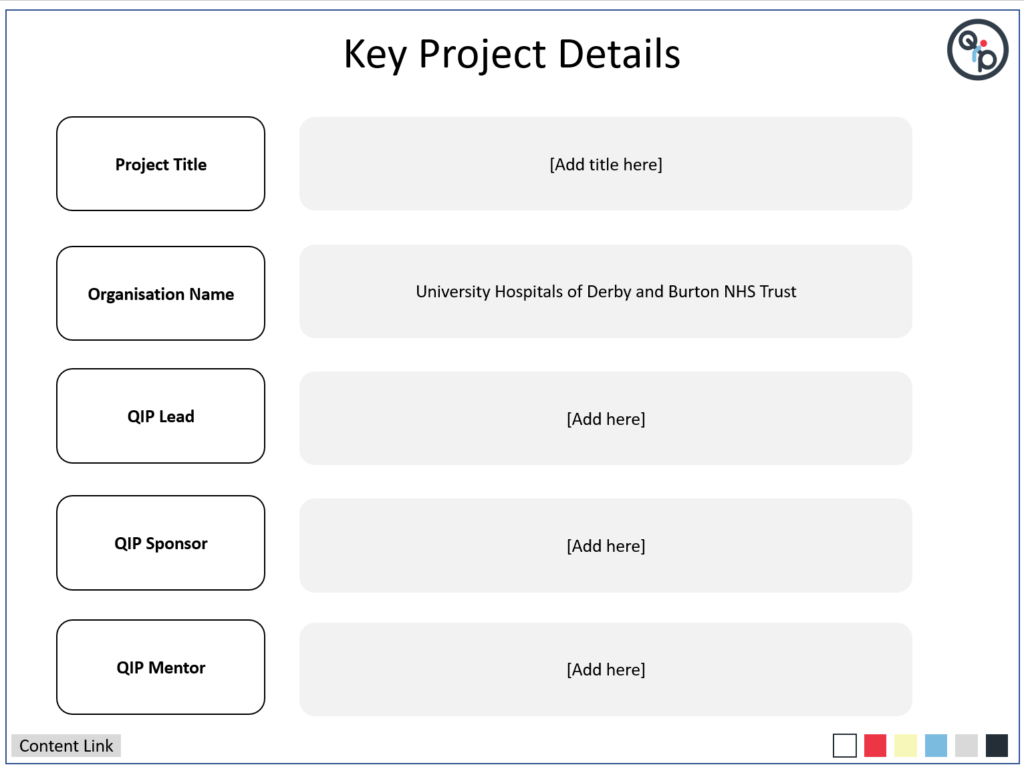
In the project information section.
You will enter the Key Project Details, Identify who is in your QI team. There is also a QI team meeting log. To capture notes of activity outside PDSA.
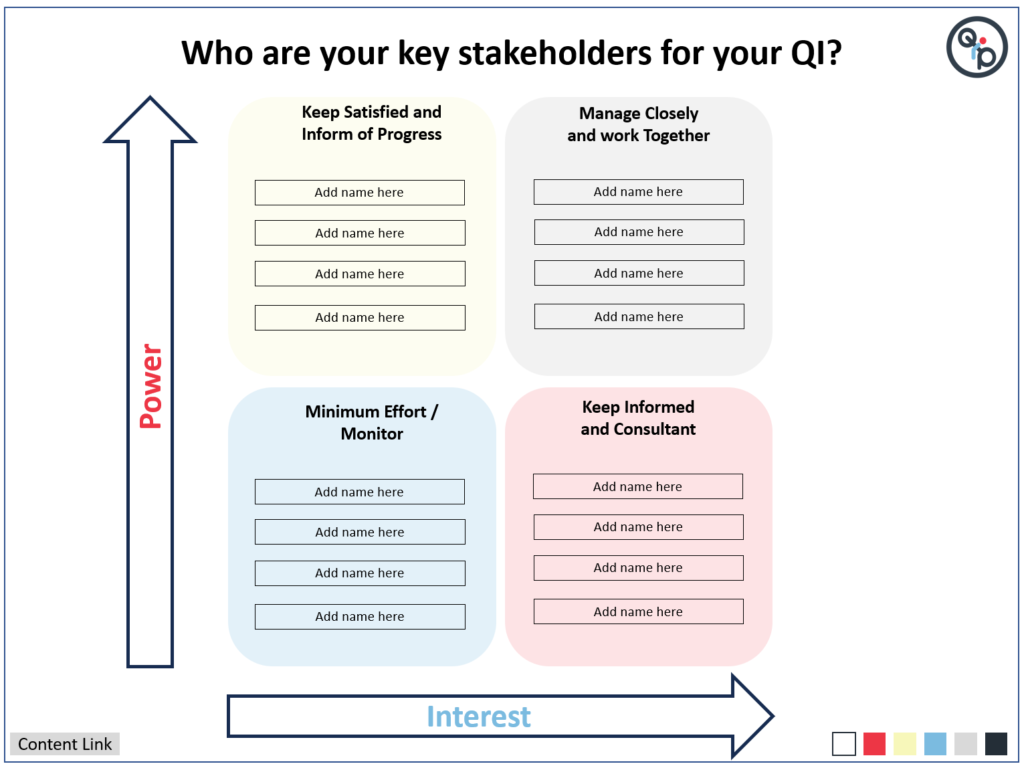
In the Identify the Problem section
You will describe what it is like currently and expand on the reason for action of the problem identified. There is a tool to capture which people will be important to engage with using a stakeholder matrix.
In the Understand the Problem section
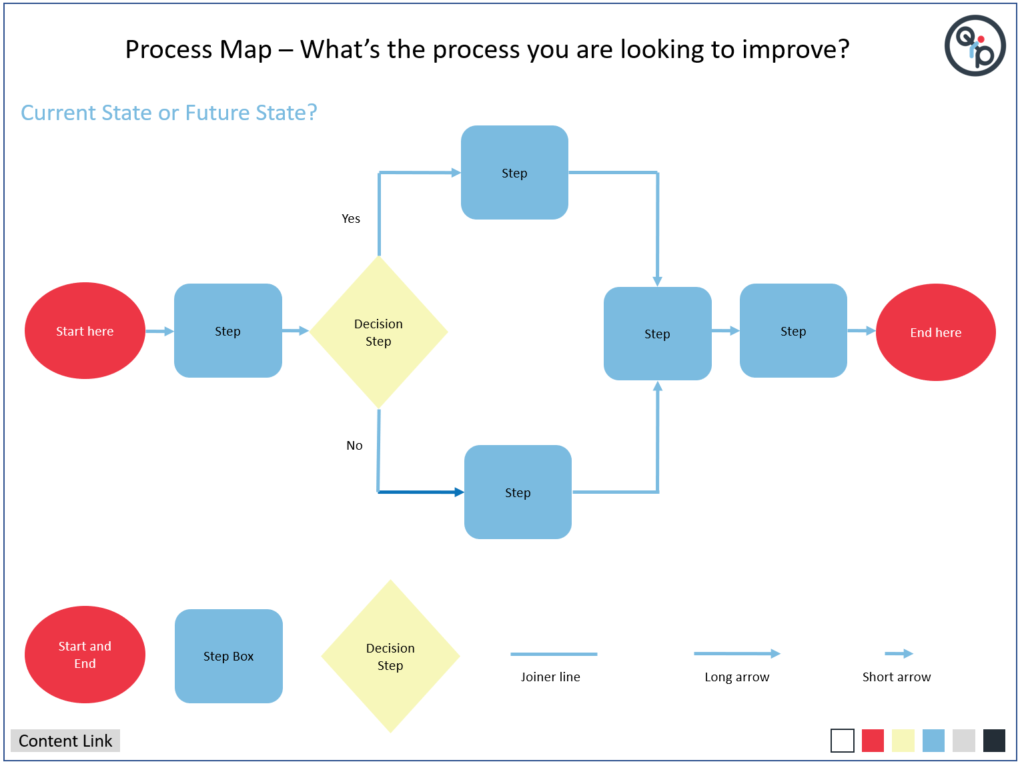
You will access to three of the most common tools that help to understand the problem better. These include Fishbone Diagram, a process map tool and finally a directly editable Pareto chart.
In the Design the Improvement Section
You will be prompted to expand on some key design questions. You will be asked to put in a SMART Aim and make a decision of what to measure and explain clearly how you will measure.
In the Deliver the Improvement Section
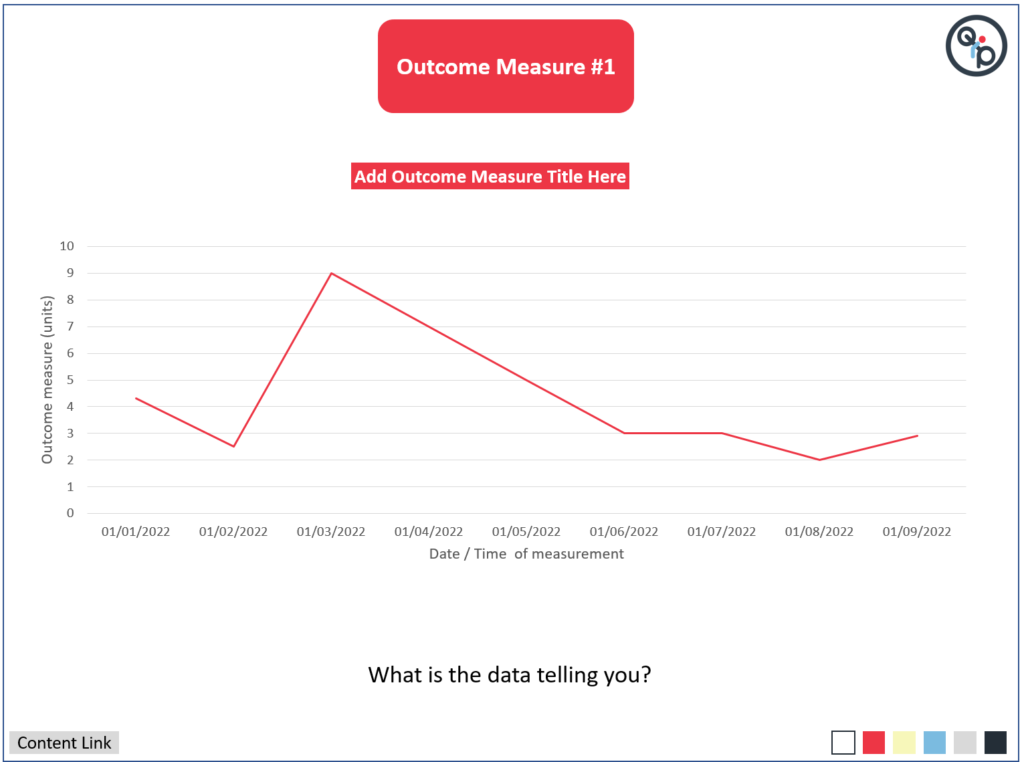
You will be given the tools to record your PDSA cycles and capture the measurements using run charts for outcome, process and balancing measures. Just duplicate the pages to add more run charts!
To change the data on the graph, it is just a simple case of [RIGHT CLICK] and scroll to ‘Edit Data’.
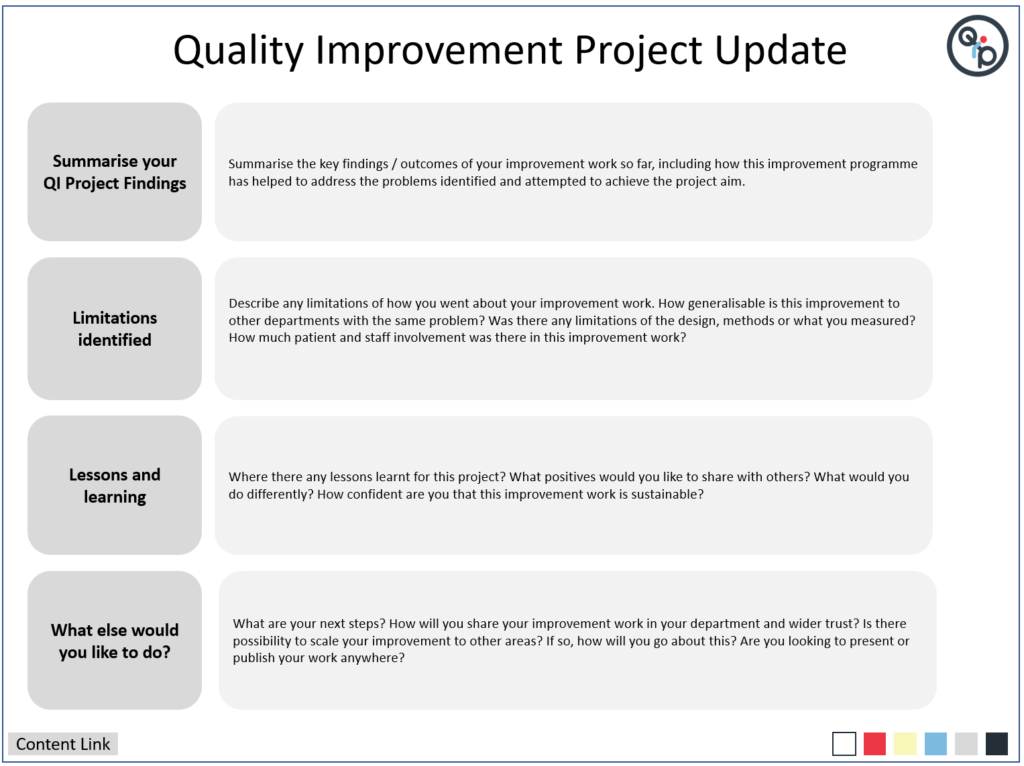
In the Sustain the Improvement Section
You will be asked to describe how you will sustain your improvement and an opportunity to provide a QI project update. this could be used as a handover document or to share with other the progress of your work so far. Remember some projects don’t ever finish as we are continually improving. So an update is all we need, rather then say we have ‘completed’ it
I
Hope you like the QI Toolkit!
Aklak Choudhury
Quality Improvement Partners
Join us for our next blog in a weeks time with Tom Rollinson